The O-buoy Project
Ozone chemistry in the Arctic is of interest due to the importance of ozone as an oxidizing agent, and because it undergoes near complete depletion events in early spring. These ozone depletion events (ODEs) were first observed in the mid-1980s. Since then, people have been trying to understand how they happen, why they happen, and how they influence other important chemical reactions in the region. It is believed that these ODEs are a product of a catalytic bromine cycle that can only happen under special conditions (e.g. low temperature, presence of sunlight, large bromine source, and ice/aerosol surface upon which to regenerate the chain precursors). Bromine comes from sea salt, which is readily available at the Arctic coastal sites where ODEs are observed. However, how the bromide converts to Br2 and BrCl, and subsequently reacts with ozone, is slightly less well understood. The current mechanism involves the bromide ion reacting with ozone, or a BrCl molecule (rxns 1-2; both of which are relatively slow). In an appropriately acidic solution (1) can go on to form the hypohalous acid and eventually molecular bromine (3), which can then photolyze to bromine radical and react with ozone (4, yields a Br radical which has a much faster rate constant for the ozone reaction than does Br-). The monoxide will then self react to form molecular oxygen and bromine (5). Since reaction 3 involves one Br atom in the gas phase (HOBr) reacting with a surface to produce two reactive bromine atoms (Br2), this is called the bromine explosion.
| Br- + O3 → BrO- + O2 | (1) |
| Br- + BrCl ←→ Br2Cl- → Br2 + Cl | (2) |
| (3) | |
| (4) | |
| 2Br0 → Br2 + O2 | (5) |
To date there have been many measurements of the BrO radical and ozone over coastal Arctic land masses; however, there have been few over the ocean (source of bromine and reactive surfaces), and certainly none for extended periods of time. The goal of our research is to measure ozone, bromine monoxide radical, CO2, and various meteorological parameters over the Arctic sea ice for periods on the order of a year without human intervention.
To achieve our goals we have collaborated with the following groups to build the autonomous O-buoy:
U.S. Army Corps of Engineers’ Cold Regions Research and Environmental Laboratories
Monterey Bay Aquarium Research Institute
University of Alaska Fairbanks
Bigelow Laboratory for Ocean Sciences
Environment and Climate Change Canada
Jonathan Amy Facility for Chemical Instrumentation at Purdue University
Once the O-Buoys are deployed, they relay the data back to land via Iridium transmission once per hour. Data from the O-Buoys can be accessed at this website.
For more details on O-Buoys and insights that they've given us, please see the following publications:
Halfacre, J. W., Knepp, T. N., Shepson, P. B., Thompson, C. R., Pratt, K. A., Li, B., Peterson, P. K., Walsh, S. J., Simpson, W. R., Matrai, P. A., Bottenheim, J. W., Netcheva, S., Perovich, D. K., and Richter, A.: Temporal and spatial characteristics of ozone depletion events from measurements in the Arctic. Atmos. Chem. Phys. 14, 4875-4894, doi:10.5194/acp-14-4875-2014, 2014. Article link
Knepp, T. N., J. Bottenheim, M. Carlsen, D. Carlson, D. Donohoue, G. Friederich, P. A. Matrai, S. Netcheva, D. K. Perovich, R. Santini, P. B. Shepson, W. Simpson, T. Valentic, C. Williams, and P. J. Wyss, Development of an autonomous sea ice tethered buoy for the study of ocean-atmosphere-sea ice-snow pack interactions: the O-buoy, Atmos. Meas. Tech., 3, 249-261, 2010. Article link
Instruments can be seen in the figures below. As of 2015, a total of fifteen O-Buoys have been deployed at regions spanning from the Beaufort Sea, to the East Siberian Sea, to the North Pole.
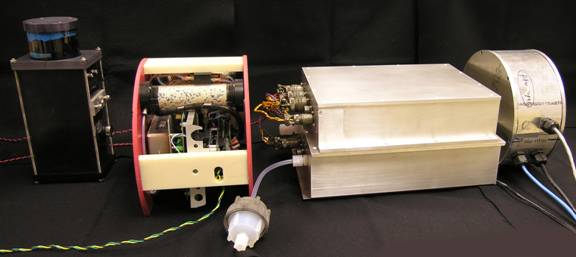
Figure 1: Instrumentation that will be put in the buoy (not pictured is the central computer and satellite communications box (Iridium)).
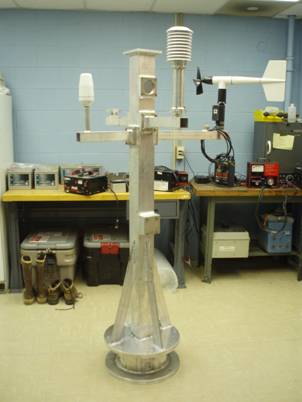
Figure 2: Picture of the mast that will be the top of the buoy including the various meteorological instruments (wind speed, humidity, temperature, orientation).
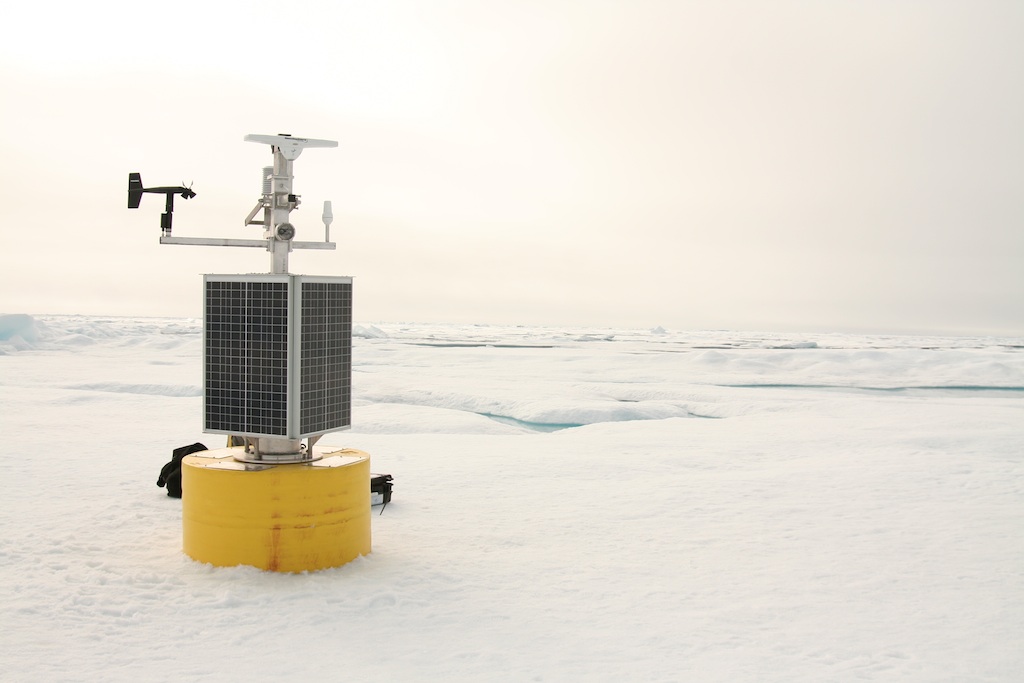
Figure 3: Fully deployed O-buoy installed in the Arctic Ocean.
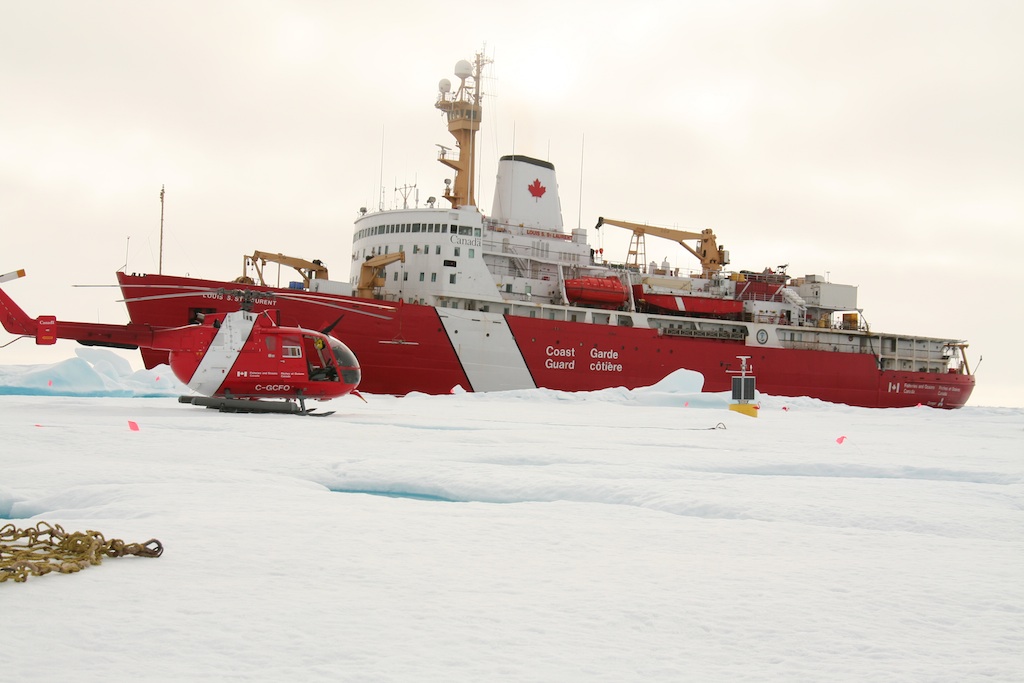
Figure 4: O-buoy deployments often involve alternate forms of transportation to travel in the Arctic (Canadian Coast Guard Ship Louis S. Saint Laurent seen above).
You can see additional photos from a O-buoy deployments here.