Airborne Laboratory for Atmospheric Research
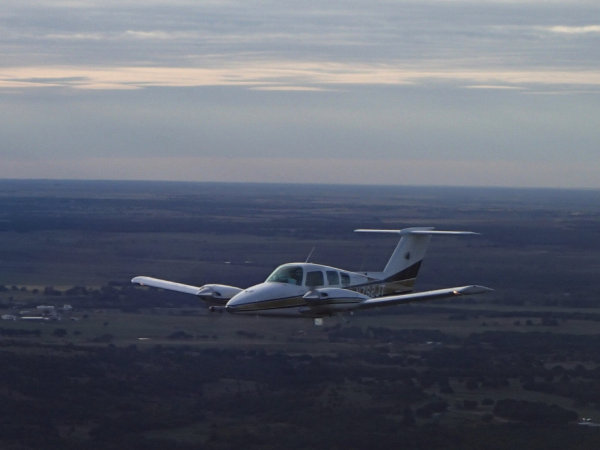
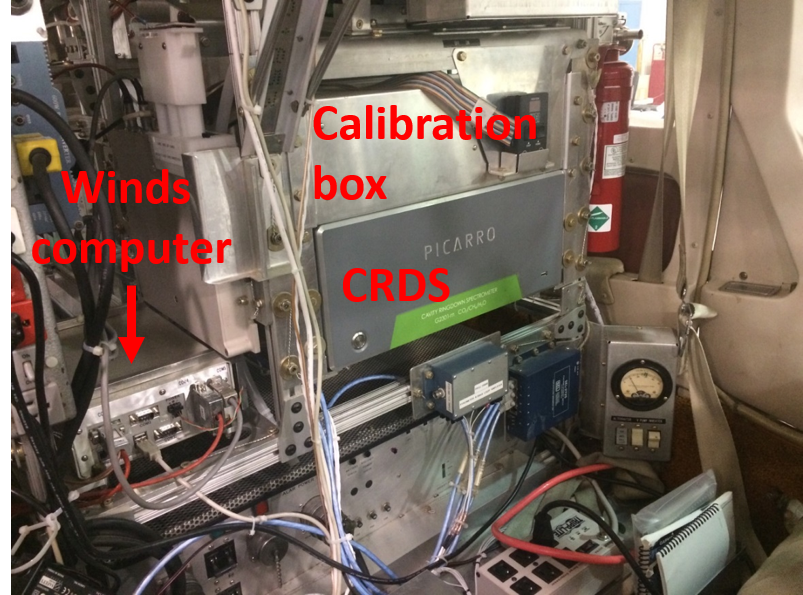
We have developed the capability to routinely measure the fluxes of greenhouse gases using ALAR, an instrumented Beechcraft BE76 Duchess aircraft (top left picture). We focus on quantifying emissions of carbon dioxide (CO2) and methane (CH4) from urban areas and point sources, such as power plants, landfills, and natural gas drilling and holding sites. A Picarro cavity ring-down spectrometer (CRDS; bottom left picture) has permanent residence behind the ALAR's pilot seat for measurements of CO2, CH4, and H2O. The rear two seats of the aircraft have been removed to accommodate the installation of other instruments which we rotate depending on our science questions.
Real-time (50Hz) vertical wind data is measured using the BAT probe developed by Crawford et al., Bound. Lay. Meteor, 1992. The vertical wind data is complemented by aircraft altitude measurements using an inertial navigation system and Global Positioning System. A set of wind tunnel and in-flight experiments were used to calibrate and characterize the vertical wind system to minimize systematic errors caused by airflow measurements that depart from a commonly used theoretical potential flow model. The results of these vertical wind studies are published in Garman et al., J. Atmos. Ocean. Tech., 2006.
Current Projects:
The INdianapolis FLUX Experiment (INFLUX)
Quantifying greenhouse gas (GHG) emissions from Indianapolis is an ongoing project in our group, part of the Indianapolis Flux Experiment (INFLUX), that we created. INFLUX is a multi-institutional collaborative effort aimed at developing, improving and evaluating techniques to quantify GHG emissions. Because cities are major GHG sources, future attempts at carbon mitigation strategies will likely rely on GHG reduction from cities. This will require the ability to quantify and verify emission reductions.
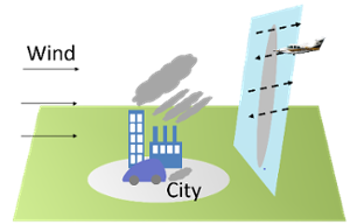
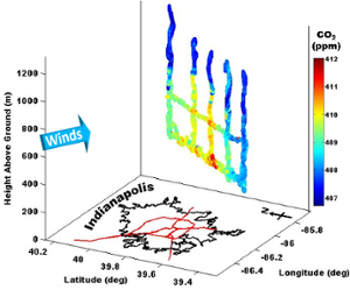
As air flows across urban areas, it picks up CO2 and CH4 emissions from point sources such as power plants, cars, and natural gas leaks, as depicted in the schematic below (left). Flying downwind of the city at multiple altitudes and perpendicular to the prevailing wind direction produces a picture of the urban CO2 and CH4 plume. Using this airborne mass-balance approach (urban enhancement = downwind-background) we can calculate the emission rate of GHG's from urban areas. We show an example mass balance flight path below on the right.
The Northeast Corridor
We have been working with the National Institute of Standards and Technology (NIST) and the University of Maryland (UMD) to also focus on the northeast corridor urban areas, primarily Washington, D.C., Baltimore, New York City, and more recently Philadelphia. This has included many mass balance flights, many of which make use of both UMD and Purdue aircraft to more thoroughly understand emissions.
DC - Baltimore
Both UMD and ALAR have flown around the Washington - Baltimore urban area periodically for several years. UMD focuses on both air quality and greenhouse gas emissions and has published multiple articles on emissions for the region. Ren et al., J. Geophys. Res. Atmos., 2018, presented measured emission rates of CH4 using the mass balance approach and flight data from both ALAR and the UMD Cessna. Lopez-Coto et al., Environ. Sci. Technol., 2020, then used a subset of this data in an inverse modeling method to investigate CO2, CH4, and CO and the sources of variability from flight to flight. Lastly, Lopez-Coto et al., Environ. Sci. Tehcnol., 2022, used research flight data from 70 flights across six years in an inverse modeling approach to investigate trends in the CO emissions for the Washington - Baltimore area as well as the impact of COVID on emissions.
New York City
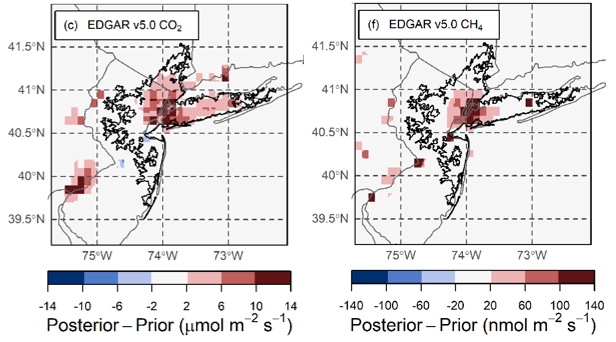
Our work in New York City has involved using modeling to better understand emissions and how our measurements compare to inventory estimates, as shown below from Pitt et al., Elem. Sci. Anthr., 2022, for one of the inventories tested. We have calculated emissions with 9 flights across 2 years using: inverse modeling in Pitt et al., Elem. Sci. Anthr., 2022, a spatially explicit inventory scaling method in Hajny et al., Elem. Sci. Anthr., 2022, and a modified mass balance approach that can focus on a specific area like a city in Tomlin et al., Elem. Sci. Anthr., 2023. These works provide CO2 emission rate estimates that are in good agreement with one another and with inventory estimates from Vulcan and the Anthropogenic Carbone Emission System (ACES) when using data from the sampled timeframe. For CH4, however, Pitt et al., Elem. Sci. Anthr., 2022, estimated an emission rate that was more than twice the value estimated by inventories. Regardless of method, the variability from flight to flight was the most significant source of uncertainty quantified.
Seawolf
Since early 2022 we have made measurements of CO2, CH4, and H2O from the R/V Seawolf, a research trawler operated by Stonybrook University. A brief video taken from ALAR is shown below (audio has been removed given the volume of the aircraft engines). The ship routinely cruises around Long Island and to the South along the New Jersey coast as part of other ongoing research projects. As our instrument is running near continuously, whenever the wind is blowing out to sea we are able to catch the urban outflow of emissions. This data can be collected far more regularly than research flights, though its use is complicated by potential changes in atmospheric mixing when transitioning from land to sea.
Philadelphia
Most recently we have begun conducting flights in and around Philadelphia with about 10 successful flights since 2019, primarily in the non-growing season. Our research goal is to use similar methods as applied to the other cities with this flight data to analyze emissions and potentially analyze emissions trends.
Modeling Turbulence in NYC
 Part of quantifying GHG emissions from cities requires accurate model depictions of the airflow in and around those cities. Cities present a rough surface, often rougher than the natural environment, that can create eddies in the atmosphere which affect mixing and vertical motion, and thus GHG dispersion. Turbulent kinetic energy (TKE) is a measure of this turbulence in the atmosphere.
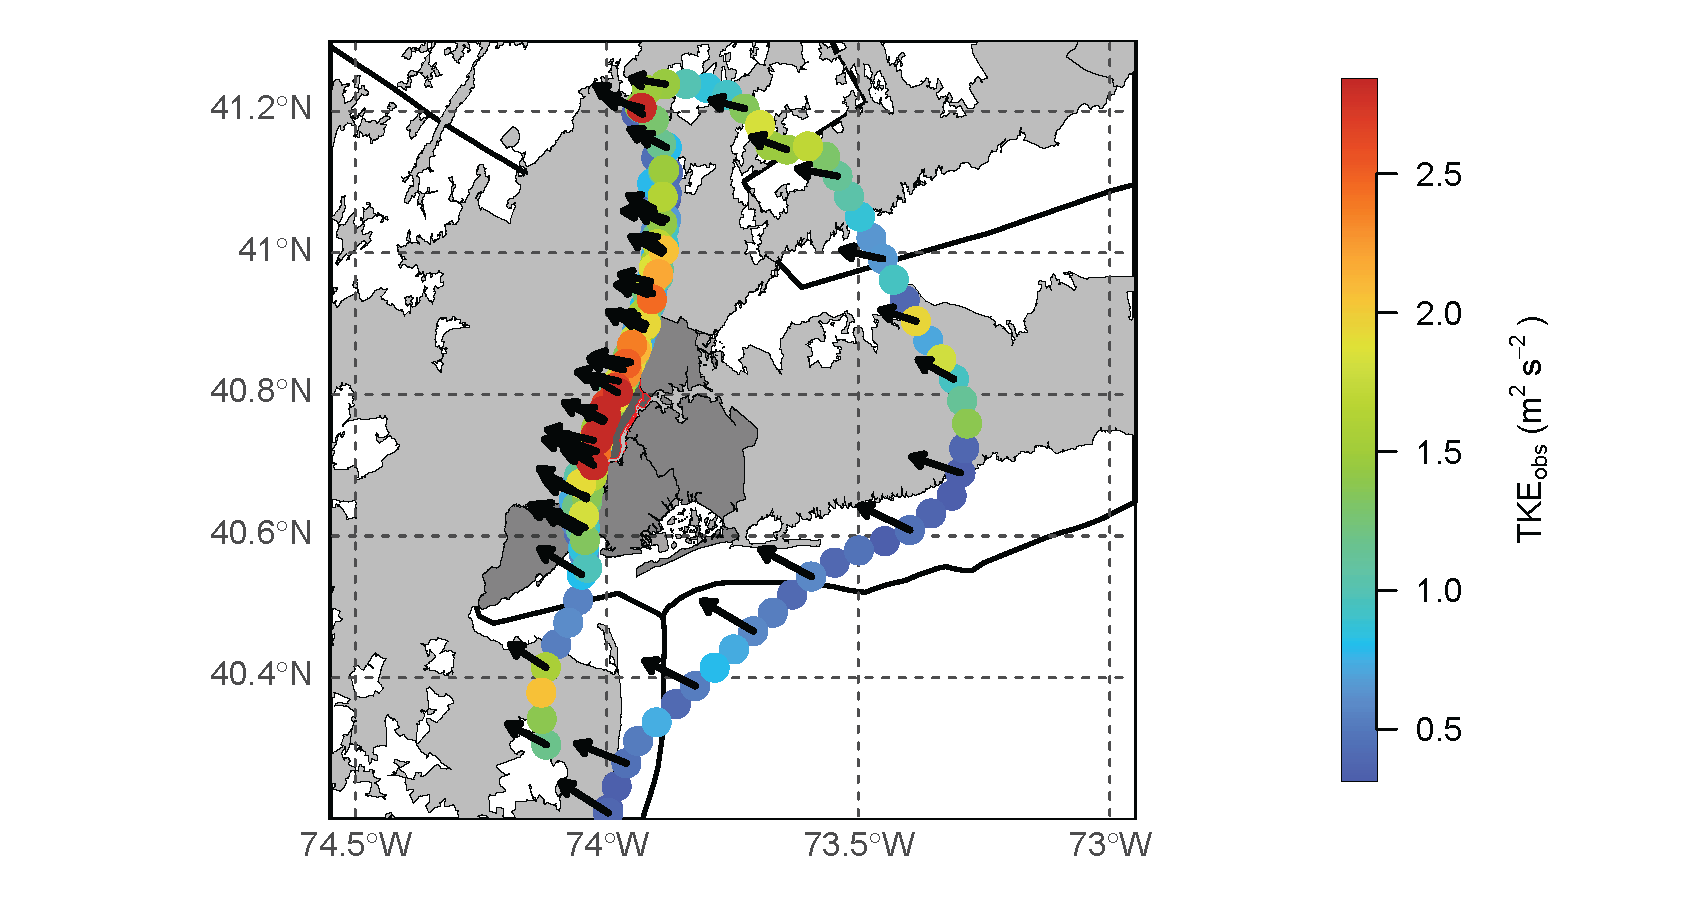
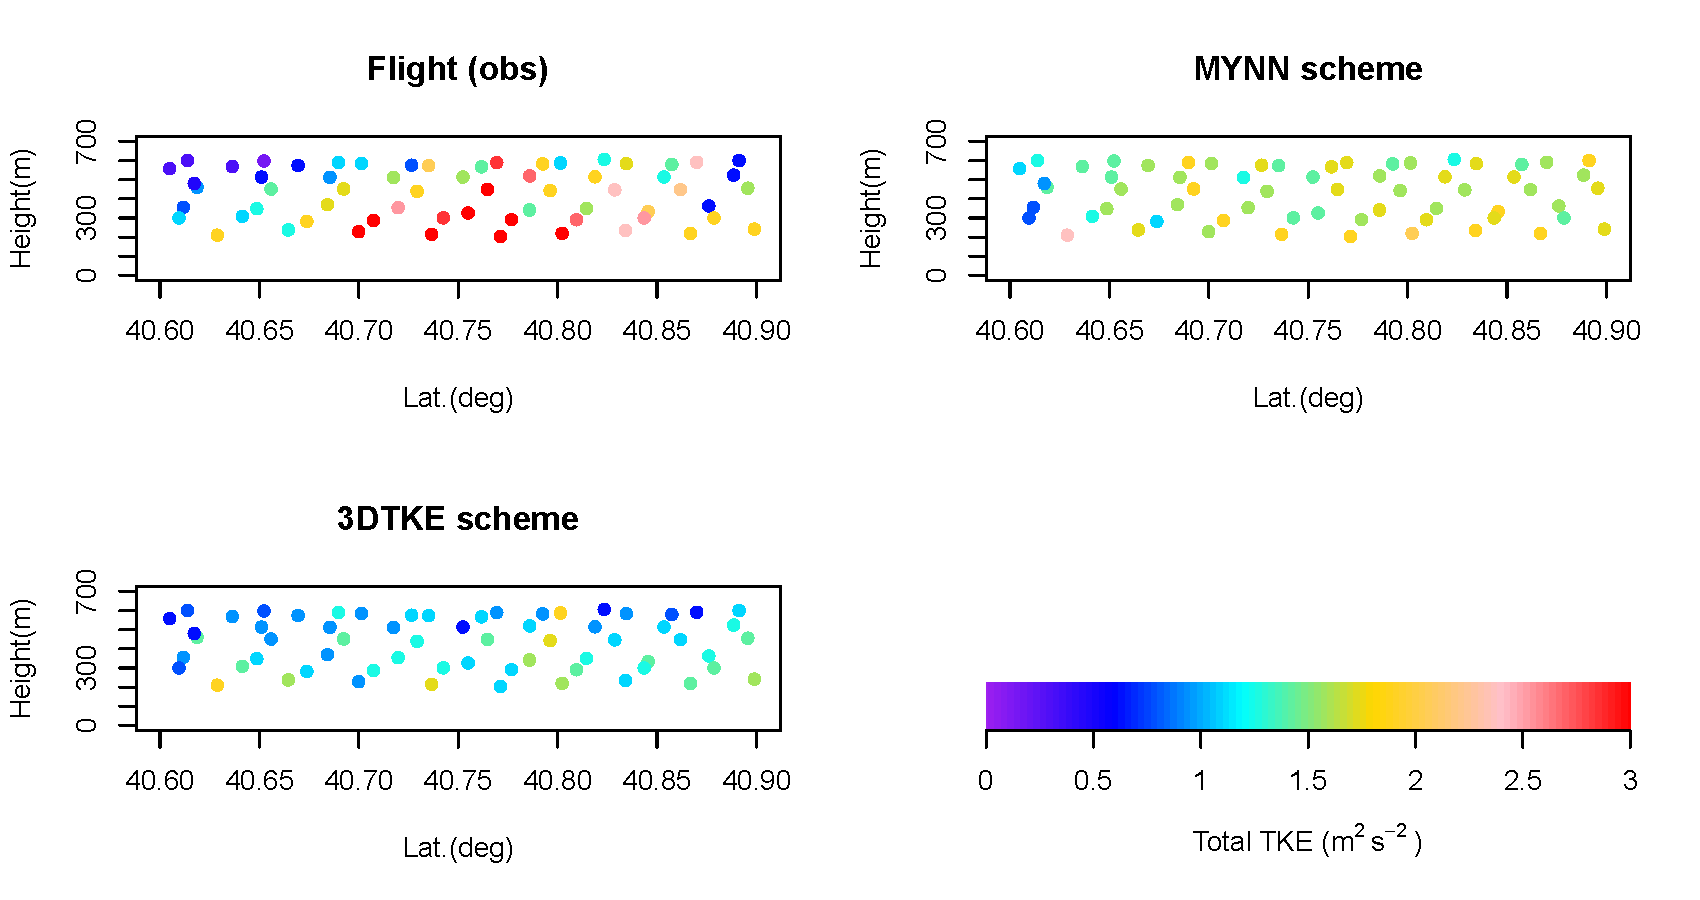
Hope et al., J. Appl. Meteorol. Climatol., 2024 used high-frequency wind data from ALAR's BAT probe to quantify the TKE around New York City, (example flight on left,) then simulated the atmosphere on those days in the Weather Research and Forecasting (WRF) model to see how well the model simulates the observed TKE. They found that WRF generally underestimates TKE directly downwind of the major skyscrapers in Manhattan (curtain plots below) using several of the different schemes available in WRF for modeling the atmospheric boundary layer.
We are also using WRF-Chem to simulate a CO2 tracer plume originating from NYC to examine how the differences in TKE simulation affect tracer mixing. While the differences in the plume significantly downwind of NYC between schemes are negligible, there are significant differences between schemes directly downwind of NYC in the vertical distribution of the tracer and how quickly the mean plume height rises with distance from the emission source.
You can see photos from ALAR-related projects here.
Past ALAR projects:
- Comparing modeled and measured winds downwind of NYC: Hope et al., 2024, J. Appl. Meteor. Climatol.
- Assessing the capabilities of the aircraft mass balance method: Hajny et al., 2023, Elementa
- Quantification of emissions from the northeast corridor:
-
Spatially explicit mass balance estimations of New York City CO2 emissions: Tomlin et al., 2023, Elementa
-
Trend analysis of and COVID impact on CO emissions from DC-Baltimore: Lopez-Coto et al., 2022, ES&T
-
Spatially explicit inventory scaling of New York City CO2 emissions: Hajny et al., 2022, Elementa
-
Inverse modeling of New York City CO2 and CH4 emissions: Pitt et al., 2022, Elementa
- Relative emissions of biogenic and natural gas-derived methane from 7 cities: Floerchinger et al., 2021, Elementa
- Quantifying CO2, CH4, and CO from DC-Baltimore via inversion: Lopez-Coto et al., 2020, ES&T
- Quantifying CH4 from DC-Baltimore via MBE and comparison to inventories: Ren et al., 2018, JGR: Atmospheres
- Quantifying NOx and CO from DC-Baltimore: Salmon et al., 2018, ACP
-
- Chemical imaging of aerosol collected over crop fields: Tomlin et al., 2020, ACS Earth Space Chem.
- Urban water vapor and its vertical distribution:
- Isotopic study of the vertical distribution of water vapor: Salmon et al., 2019, ACP
- Urban emissions of water vapor downwind of Indianapolis and DC-Baltimore: Salmon et al., 2017, JGR: Atmospheres
- Quantifying emissions from power plants:
- Followup study with a much larger number of facilities: Hajny et al., 2019, ES&T
- Initial study of natural gas-fired power plants and oil refineries: Lavoie et al., 2017, ES&T
- Particle number concentration over the Great Lakes
- Lake spray aerosol's affect on clouds: Olson et al., 2019, ACS Earth Space Chem.
- Aerosol production from the surface of the great lakes: Slade et al., 2010, GRL.
- INFLUX papers:
- Improving the precision of the airborne mass balance experiment: Heimburger et al., 2017, Elementa
- CH4 emissions from landfills: Cambaliza et al., 2017, Elementa
- Quantifying and partitioning Indianapolis CH4 emissions: Cambaliza et al., 2015, Elementa
- Assessing the uncertainties of the aircraft mass balance approach: Cambaliza et al., 2014, ACP
- Our first Indianapolis emissions paper!: Mays et al., 2009, ES&T
- Quantifying emissions from an urban Indiana landfill: Cambaliza et al., 2017, ES&T
- AirMOSS - Forest CO2 exchange using airborne eddy covariance
- Quantifying emissions from shale formations:
- Spatiotemporal variability of CH4 emissions from the Eagle Ford Basin: Lavoie et al., 2017, ES&T
- Barnett Shale emissions: Lavoie et al., 2015, ES&T
- Marcellus Shale emissions: Caulton et al., 2014, PNAS
- Flaring efficiency: Caulton et al., 2014, ES&T
- Measuring HONO over a forest canopy:
- HONO vertical fluxes over a forest canopy (complete discussion): Zhang et al., 2012, ACP
- HONO vertical fluxes over a forest canopy (highlight): Zhou et al., 2017, Nature Geoscience
- Profiles of HONO over a forest canopy: Zhang et al., 2009, GRL
- Regional CO2 surface fluxes: Martins et al., 2009, Agr. Forest Meteorol.
- Vertical winds correction due to aircraft lift-induced upwash: Garman et al. 2008, Bound. Lay. Meteorol.